Most trading strategies fail not because they're wrong, but because they're unnecessarily complex. The more moving parts a system has, the harder it becomes to execute consistently — and consistency is what separates professional traders from those perpetually stuck in tutorial hell.
What follows is a detailed breakdown of a structure-and-momentum-based trading approach that has generated verifiable returns over nearly a decade. This isn't about chasing indicators or overengineering entries. It's about reading who controls the market, where they're likely to push price, and positioning accordingly.
🧭 The Foundation: Market Structure and Momentum
Trading boils down to two questions:
- Who is in control? (Buyers or sellers)
- Where is price likely going next?
Answering these requires understanding market structure — the directional bias established by how price moves — and momentum, which reveals where institutional participants are engaging.
📈 Reading Market Structure
Price doesn't move randomly. It trends. In an uptrend, the market prints higher highs and higher lows. Each time price breaks above a prior high after establishing a low, that's a break of structure (BOS). These breaks confirm buyer control and suggest continued demand.
Conversely, in a downtrend, lower lows and lower highs dominate. Each fresh low represents another break of structure to the downside, signaling seller dominance.
The critical inflection point is the change of character (CHOCH). In an uptrend, if price breaks below a recent higher low, that signals a potential loss of buyer control. In a downtrend, a new high above a recent lower high hints that buyers may be returning. These shifts don't guarantee reversals, but they do signal that the prevailing trend may be weakening.
"All we're trying to do is figure out who's in control, where the market is likely to go, and then positioning ourselves into that."
⚡ Momentum: Reading the Auction
Markets are auctions. Price rises when buyers are willing to pay more; it falls when sellers offload and bids dry up. Understanding this dynamic allows traders to identify where demand or supply emerged and anticipate where price might pause, reverse, or accelerate.
At key swing points — where trends begin or break down — price often returns to test whether that shift was genuine. These retests offer high-probability entry zones, provided the broader structure supports continuation.
🔲 Fair Value Gaps: The Momentum Signature
A fair value gap (FVG) occurs when price moves so quickly through a zone that the market doesn't establish equilibrium. Technically, it's a three-candle sequence where:
- In a bullish FVG, the high of the first candle doesn't overlap with the low of the third.
- In a bearish FVG, the low of the first candle doesn't overlap with the high of the third.
This creates a visible gap. Importantly, FVGs are not high-volume zones — they're the opposite. They represent areas where one side of the market dominated so aggressively that participation was one-sided. When momentum fades, price often retraces into these gaps to establish fair value before continuing in the direction of the initial move.
This behavior makes FVGs excellent for targeting entries, especially when aligned with structural levels.
🗺️ Higher Timeframe Analysis: Zooming Out Before Zooming In
Executing on instinct or single timeframe analysis is a recipe for confusion. Professional traders use multi-timeframe analysis to establish directional bias on a higher timeframe, then drill down to a lower timeframe for precision entries.
Think of it like planning a road trip. You plot the overall route first, then zoom in to decide which streets to turn on. In trading terms:
- Step 1: Analyze the 15-minute chart to determine trend, key structural levels, and FVG zones.
- Step 2: Zoom into the 1-minute chart to execute precise entries aligned with the higher timeframe bias.
This approach prevents chasing noise while keeping execution aligned with the broader market move.
🎯 The Entry Model: Four Simple Steps
Once higher timeframe analysis is complete, entries follow a repeatable four-step process:
1. Wait for a Change of Character (CHOCH)
On the 1-minute chart, after the session open, wait for price to print a higher high following a lower low (or vice versa). This signals a potential shift in control.
2. Identify the Fair Value Gap (FVG)
Look for the FVG that formed during the CHOCH. This is the momentum zone that triggered the shift.
3. Enter on the Pullback
Wait for price to retrace into the midpoint (50%) of that FVG. This is the entry zone.
4. Set Stop Loss and Target
Place the stop loss beneath the most recent structural low. Target 3–4x risk (3R to 4R). This ensures favorable risk-reward even with a sub-50% win rate.
💰 Position Sizing and Risk Management
Risk management isn't optional. Every trade should risk a fixed percentage of the account — typically 1–2%. On a $500 account, that's $5–$10 per trade. On a $1,000 account, $10–$20.
To calculate position size:
- Determine entry price and stop loss price.
- Subtract stop from entry to find the distance risked.
- Divide desired dollar risk by that distance to get position size in units.
For example, if entering at 86.12 with a stop at 85.94, the risk per unit is 0.18. To risk $10, the trader would buy approximately 55 units. TradingView offers built-in position sizing tools that automate this calculation.
🔧 Leverage and Capital Access
Many new traders face a capital barrier. To control 192 units of an asset priced at 73.62 per unit requires over $14,000 — far beyond most starting balances. This is where leverage becomes useful.
- At 10x leverage, the same position requires $1,400.
- At 25x leverage, it requires just $580.
Importantly, leverage does not increase risk if position sizing is done correctly. The dollar risk remains fixed (e.g., $50), but the capital requirement drops.
An alternative route is funded trading accounts (prop firms), where traders prove profitability on a demo challenge and gain access to $25K–$100K+ in firm capital.
📊 Real Trade Walkthrough
Here's how this framework plays out in practice:
Setup: On the 15-minute chart, price pulls into a higher timeframe FVG and begins rejecting. The broader trend is bullish, with clear breaks of structure to the upside. A lower structural range is marked, and FVGs are identified as potential bounce zones.
Execution: On the 1-minute chart, price makes a low, then breaks above a recent swing high — a CHOCH. A bullish FVG forms during this move. Price retraces into the midpoint of the FVG. Entry is set at the 50% level, stop loss beneath the prior low, and target at 1:4 risk-reward.
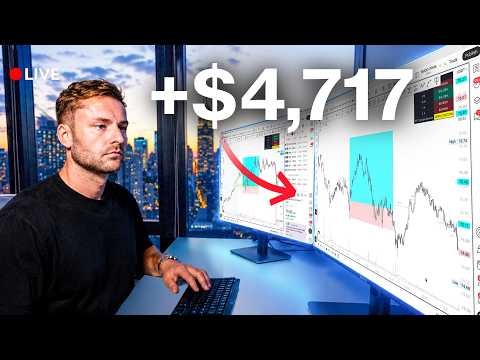
Outcome: Price respects the FVG, rallies cleanly, and hits the 4R target. On one such trade, the trader netted $6,200 using proper position sizing and leverage.
✅ The Repeatable Process
Profitable trading isn't about finding the perfect setup once. It's about executing a repeatable process that works over time. Here's the checklist:
- Mark breaks of structure and changes of character on the 15-minute chart.
- Identify fair value gaps aligned with structural levels.
- Wait for a CHOCH on the 1-minute chart.
- Enter at the 50% retracement of the FVG.
- Set stop loss below structure, target 3–4R.
- Use proper position sizing to risk 1–2% per trade.
This framework isn't magic. It's structure, patience, and disciplined execution. But applied consistently, it turns market noise into readable, tradable information.
The strategy outlined here was used to generate over $57,000 in a single month, documented live. It's built on nine years of refinement, focused on simplicity, repeatability, and scalability. The edge isn't in complexity — it's in clarity.