SOL

Sol The Trophy Tomato Price Prediction 2026

SOL
Solana
AI Analysis
Analysis as of May 4, 2026

jk1T35eWK41MBMM8AWoYVaNbjHEEQzMDetTsfnqpump

$0.000212

-0.25%

FDV $173,668

LiveContract:jk1T35eWK41MBMM8AWoYVaNbjHEEQzMDetTsfnqpumpChain:SolanaHolders:6,534Market cap:$173,668

More tokens on Solana

Continue in chat

Ask Unhosted AI about SOL

Report snapshotas of May 4, 09:47 PM
FDV

$1,175,681

Liquidity

$162,124

Holders

6,537

Snipers

0

Risk

High

AI Executive Summary

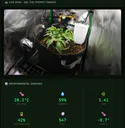
Sol The Trophy Tomato (SOL) is a PumpSwap-listed Solana meme/experiment token with mint address jk1T35eWK41MBMM8AWoYVaNbjHEEQzMDetTsfnqpump. The project frames itself as a real-world AI autonomy experiment — an AI system independently manages a live trophy tomato plant's environment, with the token serving as a community funding and observation mechanism. The token has surged ~120% in 24 hours to $0.001433, with a fully diluted valuation of ~$1.18M and $162K in total liquidity on PumpSwap. Despite the price spike, sell pressure dominates heavily (75.8% sell volume), and holder growth has been sluggish over the past 30 days, raising sustainability concerns.

Risk: High
Sentiment: Bearish
Unique real-world AI/biology experiment narrative tying token utility to a live tomato plant
Zero snipers detected in the first 1,000 blocks — clean launch with no sniper concentration risk
Verified contract with immutable metadata (mutable: false)
PumpSwap listing with $162K liquidity and 6,537 holders providing a modest community base
120%+ 24h price surge driven by organic trading activity rather than sniper manipulation

Price Prediction

bearish

Short term

bearish
1–48 hours

The token has spiked ~120% in 24h, closing at $0.001433. However, sell pressure is overwhelming (75.8% of 24h volume), with 930 sells vs 367 buys and 362 sellers vs 123 buyers. The most recent candle [1] shows a wide-range bullish candle (O:0.001149, H:0.001453, C:0.001433) but the prior candle [2] was flat/doji-like, suggesting the move may be exhausting. A mean-reversion pullback toward the $0.00090–$0.00100 zone is likely in the near term.

Target low$0.00085
Target high$0.00155
Support: $0.00113 (candle [2] close / prior consolidation), $0.00090 (candle [4] open / candle [5] high zone), $0.00073 (candle [9] open / candle [22] close zone)
Resistance: $0.001453 (candle [1] and [4] intraday highs — 24h peak), $0.001461 (candle [4] high — absolute 24h resistance), $0.00165 (psychological extension level)

Medium term

neutral
1–4 weeks

Medium-term direction depends heavily on whether the AI/tomato experiment narrative gains broader traction and whether the project delivers visible milestones. Holder growth has been essentially flat-to-declining over most of the past 30 days (net -2 to -26 per day from Apr 20–May 2), with only a brief spike in mid-April. Without sustained community growth or a catalyst, price is likely to retrace and consolidate in the $0.00070–$0.00110 range.

Catalysts
  • Viral social media coverage of the AI tomato experiment
  • New exchange listings or integrations
  • Demonstrable AI experiment milestones (e.g., plant health updates, sensor data transparency)
  • Broader Solana meme token market rally

Bullish factors

  • 120%+ 24h price surge with accelerating momentum (5m: +10.2%, 1h: +18.5%, 6h: +69%)
  • Zero snipers detected — clean launch reduces dump risk from early insiders
  • Unique and novel AI/biology experiment narrative with community appeal
  • Verified contract and immutable metadata reduce rug risk
  • 6,537 holders provide a baseline community

Bearish factors

  • Overwhelming sell pressure: 75.8% sell volume ($148K sells vs $47K buys)
  • 930 sells vs 367 buys in 24h — sellers outnumber buyers nearly 3:1
  • Holder count was declining or flat for most of April (net negative days Apr 20–May 2)
  • Shallow liquidity ($162K) creates high slippage risk on larger trades
  • Top 10 holders control 28.67%, top 100 control 80.49% — concentrated distribution
  • FDV of ~$1.18M is modest but may not support sustained price appreciation without new buyers
Confidence: low. Confidence is low due to the extreme 24h volatility (+120%), dominant sell pressure (75.8%), shallow liquidity ($162K), and a speculative narrative-driven token with no on-chain sniper data to assess early buyer behavior. The token's price action is highly susceptible to sentiment swings.

Deep Analysis

Over the 24 hourly candles analyzed (May 3 22:00 UTC to May 4 21:00 UTC), the token traded in a clear uptrend from a base near $0.000654 (candle [24]) to a high of $0.001461 (candle [4]) before consolidating and then breaking out again in the final candle [1] to close at $0.001433. The early candles [22–24] show a tight base with very low volume (~100–156 USD), followed by a gradual grind higher through candles [21–17]. A notable surge occurred at candle [4] (18:00 UTC) with a wide-range bullish candle (O:0.000899, H:0.001461, C:0.001198, V:$26K) — the highest-volume candle in the series alongside candle [3] ($74K volume). The final candle [1] is the strongest close of the series at $0.001433 with $18K volume, suggesting continued momentum but also potential exhaustion near the 24h high.

Trend

Short-term
uptrend
Medium-term
sideways

Momentum

Status
overbought

Volume

Trendincreasing
Buy 24%Sell 76%

Short-term trend is clearly bullish — the token made higher lows and higher highs throughout the 24h window, with the price more than doubling from the $0.000654 base. Medium-term trend (30-day holder data) is sideways-to-declining, with holder counts oscillating between 6,297 and 6,477 and no sustained upward trajectory until the most recent 24h spike.

Key Price Levels

Support
Immediate$0.001149 (candle [2] close — prior hour consolidation level)
Major$0.000731 (candle [9] open / candle [21] low — mid-range support zone)
Resistance
Immediate$0.001453 (candle [1] high — current 24h peak)
Major$0.001461 (candle [4] high — absolute 24h resistance ceiling)

The immediate support at $0.001149 is the most critical near-term level — a break below this would signal the pump is reversing. Major support at $0.000731 represents the pre-breakout consolidation zone. Resistance is clustered tightly at $0.001453–$0.001461, the twin intraday highs from candles [1] and [4]. A sustained close above $0.001461 would be a bullish continuation signal.

Notable patterns

  • Parabolic pump: price doubled in ~24 hours from $0.000654 base to $0.001433 close
  • Volume climax at candle [3] ($74.5K) — highest volume candle, potential exhaustion signal
  • Wide-range bullish candle at [4] (18:00 UTC) with upper wick — partial rejection at $0.001461
  • Higher highs and higher lows throughout the 24h window — confirmed short-term uptrend
  • Low-volume base formation in candles [23–24] (~$100–156 volume) before the breakout
  • Candle [2] is a near-doji (O≈C at $0.001149) — brief consolidation before final leg up in candle [1]
  • Candle [1] closes near its high ($0.001433 vs H:$0.001453) — bullish close but near resistance

Total holders6,537
24h Δ+2
7d Δ+2.1
30d Δ+3.3
Accelerating Growth
Yes

Correlation with price

Holder growth has been largely flat-to-negative for most of April (net negative days from Apr 20 to May 2, with counts declining from 6,471 to 6,372). The recent 24h spike of +133 holders (+2.0%) coincides directly with the 120% price surge, suggesting the price pump is attracting new holders rather than organic community growth driving price. This is a reactive rather than leading relationship — price moved first, holders followed.

Over the 30-day historical window, holder counts ranged from 6,297 (Apr 10) to 6,477 (Apr 19), showing a net gain of only ~218 holders (+3.3%) over the full month. The trend was predominantly declining or flat from Apr 20 through May 2, with consistent small negative daily changes (-2 to -26 per day). A brief positive spike occurred Apr 17–19 (+88 holders on Apr 19, +62 on Apr 18), likely tied to a prior price event. The most recent 24h shows +133 holders, the largest single-day gain in the dataset, accelerating sharply in correlation with the price pump. The 7d growth of +140 holders is almost entirely attributable to the last 24h, meaning the prior 6 days were essentially flat. Holder acquisition is predominantly via swap (5,438 of 6,537), confirming most holders are active traders rather than airdrop recipients (107) or passive transfer recipients (992).

Top 10 hold28.67%
Top 100 hold80.49%
Sentiment
Mixed

Notable holders

CcYbXbMHr2o9Vyz2wmJcRvi59wh42xkXf6qrzChbHPN5

DEX liquidity pool — this address matches the PumpSwap pair address listed in the price data

7.67%

7pY1dPku8jfojw6XZhvbN5d3hNSU4RzAktMt33jgpYnh

Individual whale — large holder, likely an early buyer or project-affiliated wallet

4.27%

4hwPamSooBr5JhxHdcEC21HoxN5HUwYR2hGucLPyZAi8

Individual whale — significant holder with no obvious exchange or contract classification

3.27%

5uWiSJevQw39bX4xryoTxC8uqjaBmviwhtKEhFtcHHLb

Individual whale — mid-tier large holder

2.65%

GjXobpiEexQqqLkghB29AtcwyJRokbeGDSkz8Kn7GGr1

Individual whale — mid-tier large holder

2.54%

The top 10 holders control 28.67% of supply and the top 100 control 80.49%, indicating a concentrated distribution that is typical for PumpFun-launched tokens but still poses meaningful dump risk. The largest single holder (7.67%, address CcYbXbMHr2o9Vyz2wmJcRvi59wh42xkXf6qrzChbHPN5) is the PumpSwap liquidity pool pair address — this is expected and not a concern. Excluding the LP, the next 9 holders control ~21% of supply collectively. Holders [9] and [13] have round-number balances (12,500,000 and 11,000,000 respectively), which may indicate project treasury or team allocations. The distribution shows 157 whales, 67 sharks, 342 dolphins, 381 fish, and 458 octopus-tier holders, suggesting a reasonably broad base below the whale tier but with meaningful concentration at the top. Sentiment is mixed — the price spike may incentivize whale distribution, but the clean launch (no snipers) suggests whales are not coordinated early insiders.

Liquidity$162,120
Depth
Shallow
Slippage risk
high

Volume (24h)

Buy$47,280
Sell$148,040
Net flow
outflow

Traders (24h)

Unique buyers123
Unique sellers362

Total liquidity of $162K on PumpSwap is shallow relative to the token's FDV of ~$1.18M, creating a liquidity-to-FDV ratio of approximately 13.7%. This means any significant sell order from a whale (e.g., the 4.27% holder with ~$50K in tokens at current prices) could cause severe slippage and price impact. The 24h net flow is strongly negative — $148K in sell volume vs $47K in buy volume represents a net outflow of ~$100K, meaning the market is in active distribution. The ratio of sellers to buyers (362 vs 123, nearly 3:1) confirms broad-based selling into the price spike. Despite the price being up 120%, the volume composition tells a bearish story: the price rise was driven by a smaller number of aggressive buyers while a much larger cohort of sellers distributed into the move. This is a classic pump-and-distribute pattern. The 24h unique wallet count of 386 is relatively low for a 120% move, suggesting the pump was not driven by mass retail FOMO but rather by a concentrated buying event.

Supply & Valuation

Total supply820,421,724.40
FDV$1,175,680.77

Authorities

Mint authority
Active
Freeze authority
Active

The token has a total supply of ~820.4M with 6 decimals, consistent with a PumpFun-launched token. The FDV is $1.175M at the current price of $0.001433. The metadata indicates the contract is verified and mutable is set to false, which is a positive signal — immutable metadata means the token's on-chain metadata cannot be changed post-deployment. The update authority is listed as 'unknown' in the provided data, preventing a definitive assessment of mint and freeze authority status. Since the token was launched via PumpFun (indicated by the 'pump' suffix in the mint address), it is likely that mint authority was burned upon graduation to PumpSwap, but this cannot be confirmed from the available data. Freeze authority status is similarly unknown. Investors should verify these on-chain before committing capital. The immutable metadata (mutable: false) is a meaningful positive signal reducing metadata manipulation risk.

Volatility
high

The token surged 120% in 24 hours with extreme intraday swings. The 6h change of +69% and 1h change of +18.5% indicate parabolic momentum that is historically unsustainable. Mean-reversion risk is very high.

Liquidity
high

Total liquidity is only $162K on a single DEX (PumpSwap). Large trades will face significant slippage. A whale exit from even a 2–3% holder could move the price 10–20%+ given the shallow pool depth.

Concentration
medium

Top 10 holders control 28.67% of supply and top 100 control 80.49%. Excluding the LP pool (7.67%), individual whales hold meaningful positions. Two holders with round-number balances (12.5M and 11M tokens) may represent team/treasury allocations. Concentration is elevated but not extreme for a PumpFun token.

SniperDump
low

Zero snipers were detected in the first 1,000 blocks. This is a strong positive signal — there are no known sniper wallets sitting on large unrealized gains from launch that could dump into price strength.

Authority
medium

Mint and freeze authority status are unknown from the provided data. The update authority is listed as unknown. However, the contract is verified and metadata is immutable (mutable: false), which partially mitigates this risk. Investors should verify authority status on-chain via Solana explorers before investing.

Key risks

  • Extreme sell pressure (75.8% of 24h volume) into the price spike — classic distribution pattern
  • Shallow liquidity ($162K) creates high slippage and price impact risk
  • Holder growth was flat-to-declining for most of April — new 24h holders may be momentum chasers who sell quickly
  • Unknown mint/freeze authority status — cannot rule out rug risk from authorities
  • Single DEX listing (PumpSwap) with no diversified liquidity
  • Speculative narrative (AI tomato plant) with no verifiable on-chain proof of experiment progress
  • Top 100 holders control 80.49% of supply — significant concentration above retail tier

Mitigating factors

  • Zero snipers at launch — no coordinated early-insider dump risk
  • Verified contract with immutable metadata (mutable: false)
  • 6,537 holders provide a meaningful community base
  • Unique and differentiated narrative (AI/biology/blockchain intersection) with potential viral appeal
  • PumpFun launch mechanism typically burns mint authority upon DEX graduation
  • Social presence (Twitter, Moralis) indicates active community management
Suitable for: This token is suitable only for high-risk-tolerant, experienced crypto traders who understand meme token dynamics and can afford to lose their entire investment. It is NOT suitable for conservative investors, those seeking stable returns, or anyone investing more than a small speculative allocation. Given the 120% pump, extreme sell pressure, and shallow liquidity, entering at current prices carries significant drawdown risk.

Sol The Trophy Tomato (SOL) is a high-risk, narrative-driven meme token on Solana with a novel AI/biology experiment concept. The token has experienced a sharp 120% pump in 24 hours but faces overwhelming sell pressure (75.8%), shallow liquidity, and a history of flat-to-declining holder growth. The clean launch (zero snipers) and immutable contract are genuine positives, but the current price action appears to be a distribution event rather than the start of a sustained uptrend. The investment thesis hinges almost entirely on whether the AI tomato experiment narrative can generate sustained viral interest and community growth.

Bull case (low)

The AI tomato experiment goes viral on social media, attracting significant retail attention and new buyers. The project delivers transparent, verifiable experiment updates that build credibility. New exchange listings or integrations expand liquidity and accessibility. The broader Solana meme token market enters a bull phase, lifting all boats. In this scenario, the token could sustain its current price level or push toward a $3–5M FDV.

  • Viral social media traction for the AI/tomato experiment narrative
  • Transparent experiment milestones that build community trust
  • New DEX listings or CEX attention increasing liquidity
  • Broader Solana ecosystem bull market momentum

Base case

The token retraces 30–50% from its 24h high as sell pressure normalizes, finding support in the $0.00085–$0.00100 range. Holder count stabilizes around 6,500–6,700 as momentum chasers exit and genuine community members remain. Price consolidates in a wide range for several weeks, with occasional spikes tied to experiment updates or broader market moves. FDV stabilizes around $700K–$1M.

  • Sell pressure gradually normalizes after the initial pump exhausts
  • Core community of ~6,500 holders provides a price floor
  • Project team continues to provide experiment updates maintaining baseline interest
  • No major whale dumps that would collapse the liquidity pool
  • Broader Solana market remains neutral to slightly positive

Bear case (high)

The 120% pump reverses as sellers continue to dominate. Whale holders (top 10 ex-LP = ~21% of supply) distribute into remaining buy pressure. Liquidity drains as the price falls, creating a negative feedback loop. Holder count resumes its prior declining trend. The AI tomato narrative fails to gain traction beyond the initial pump. Price retraces 50–70% to the $0.00065–$0.00090 range within 1–2 weeks.

  • Sustained 3:1 seller-to-buyer ratio depletes buy-side liquidity
  • Whale distribution into the price spike
  • Failure to generate sustained viral interest in the experiment narrative
  • Shallow liquidity amplifying downside price moves
  • Holder growth reverting to prior flat/declining trend

GeneratedMay 4, 09:47 PM
Data freshnessData reflects on-chain state as of approximately 2026-05-04T21:00 UTC, with the most recent OHLC candle closing at that time. Holder data reflects the most recent snapshot available.
Model confidence
low

Data sources

  • On-chain token metadata (mint, decimals, supply, mutability)
  • PumpSwap pair price and liquidity data
  • 24-hour OHLC hourly candle data (24 candles)
  • 24-hour trading analytics (buy/sell volume, unique wallets, price changes)
  • Holder metrics and distribution data (total holders, acquisition method, tier breakdown)
  • Top 20 holder addresses and balances
  • 30-day daily historical holder count series
  • Sniper analysis (first 1,000 blocks)

Limitations

  • Mint and freeze authority status are unknown — cannot definitively assess rug risk from token authorities
  • Update authority is listed as unknown — limits governance risk assessment
  • No sniper data available (0 snipers) — while positive, limits smart money signal analysis
  • Holder historical data is daily granularity only — intraday holder dynamics during the pump are not visible
  • Top holder classification is inferred from address patterns and context, not verified on-chain labels
  • No order book depth data available — liquidity depth assessment is based on total TVL only
  • The AI tomato experiment's real-world status and legitimacy cannot be verified from on-chain data alone
  • FDV figures differ slightly between metadata ($1,175,680.77) and analytics ($951,650) — likely due to price snapshot timing differences

This analysis is for informational purposes only and does NOT constitute financial advice, investment recommendations, or an endorsement of this token. Cryptocurrency investments, especially meme tokens, carry extreme risk including total loss of capital. Always conduct your own research (DYOR) and consult a qualified financial advisor before making investment decisions. Past price performance is not indicative of future results.

Token Info

ChainSolana
Contract
Total Supply820,421,724.40

Key Risks

Extreme sell pressure (75.8% of 24h volume) into the price spike — classic distribution pattern
Shallow liquidity ($162K) creates high slippage and price impact risk
Holder growth was flat-to-declining for most of April — new 24h holders may be momentum chasers who sell quickly
Unknown mint/freeze authority status — cannot rule out rug risk from authorities

Smart Money & Sniper Analysis

low confidence
High risk

No snipers were detected in the first 1,000 blocks of this token's launch. This is a positive signal indicating the token was not targeted by bots or insiders at launch, reducing the risk of a coordinated early-buyer dump. However, with zero sniper data available, smart money signals cannot be derived from this source. The 24h trading data shows 362 unique sellers vs 123 unique buyers, suggesting that whoever accumulated early is now distributing into the price spike.

AI-generated insight. Not financial advice.

Sniper details

Sniper concentration0.00%
PnL stateUnknown
Sell-through rateUnknown
Profit-taking risk
high

0 snipers detected in the first 1,000 blocks — no sniper concentration

Unknown — no sniper data available. However, the dominant sell pressure (75.8% of 24h volume = $148K in sells) suggests early holders or recent buyers are taking profits aggressively into the 120% price surge.

Frequently Asked Questions

What is the price prediction for Sol The Trophy Tomato (SOL)?

The token has spiked ~120% in 24h, closing at $0.001433. However, sell pressure is overwhelming (75.8% of 24h volume), with 930 sells vs 367 buys and 362 sellers vs 123 buyers. The most recent candle [1] shows a wide-range bullish candle (O:0.001149, H:0.001453, C:0.001433) but the prior candle [2] was flat/doji-like, suggesting the move may be exhausting. A mean-reversion pullback toward the $0.00090–$0.00100 zone is likely in the near term. Short-term outlook is bearish (1–48 hours), with a target range of $0.00085 to $0.00155.

Is SOL a safe investment on Solana?

Overall risk is rated high with a risk score of 7.5/100. This token is suitable only for high-risk-tolerant, experienced crypto traders who understand meme token dynamics and can afford to lose their entire investment. It is NOT suitable for conservative investors, those seeking stable returns, or anyone investing more than a small speculative allocation. Given the 120% pump, extreme sell pressure, and shallow liquidity, entering at current prices carries significant drawdown risk.

How are SOL holders trending?

Sol The Trophy Tomato currently has 6,537 holders and is growing (24h: 2, 7d: 2.1, 30d: 3.3). Over the 30-day historical window, holder counts ranged from 6,297 (Apr 10) to 6,477 (Apr 19), showing a net gain of only ~218 holders (+3.3%) over the full month. The trend was predominantly declining or flat from Apr 20 through May 2, with consistent small negative daily changes (-2 to -26 per day). A brief positive spike occurred Apr 17–19 (+88 holders on Apr 19, +62 on Apr 18), likely tied to a prior price event. The most recent 24h shows +133 holders, the largest single-day gain in the dataset, accelerating sharply in correlation with the price pump. The 7d growth of +140 holders is almost entirely attributable to the last 24h, meaning the prior 6 days were essentially flat. Holder acquisition is predominantly via swap (5,438 of 6,537), confirming most holders are active traders rather than airdrop recipients (107) or passive transfer recipients (992).

What does sniper activity look like for SOL?

Snipers hold roughly 0.00% of supply with PnL state "unknown" and sell-through rate "unknown". Profit-taking risk: high.

What are the key risks of holding SOL?

Extreme sell pressure (75.8% of 24h volume) into the price spike — classic distribution pattern • Shallow liquidity ($162K) creates high slippage and price impact risk • Holder growth was flat-to-declining for most of April — new 24h holders may be momentum chasers who sell quickly

Track SOL