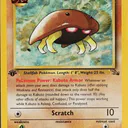
KABUTO

Kabuto Price Prediction 2026

KABUTO
Solana
AI Analysis
Analysis as of May 26, 2026

A9E2AopuG56LWYiXsvGLLTcLjUjQ539PY6k5Fhfepump

$0.000229

+15.15%

FDV $228,594

LiveContract:A9E2AopuG56LWYiXsvGLLTcLjUjQ539PY6k5FhfepumpChain:SolanaHolders:7,442Market cap:$228,594

More tokens on Solana

Continue in chat

Ask Unhosted AI about KABUTO

Report snapshotas of May 26, 06:17 AM
FDV

$718,411

Liquidity

$145,099

Holders

7,179

Snipers

0

Risk

High

AI Executive Summary

Kabuto (KABUTO) is a Solana meme/trading token on PumpSwap with a total supply of ~999.87M tokens and a fully diluted valuation of ~$718K–$830K. The token has experienced a dramatic 92%+ price surge in the past 24 hours, likely catalyzed by its narrative around a trading card price skyrocketing 1,100% in a single day. Despite the short-term price explosion, the token shows a persistent 30-day holder decline of ~11%, concentrated supply in the top 10 (33.96%), and heavily sell-dominated 24h trading activity (66.9% sell pressure). The token is unverified, mutable authority is false, and update authority is unknown.

Risk: High
Sentiment: Bearish
92%+ 24h price surge on a narrative-driven catalyst (trading card price spike)
Zero snipers detected in the first 1,000 blocks — no sniper concentration risk
Persistent 30-day holder decline of -824 holders (-11%), contrasting with the recent price pump
Top 10 holders control 33.96% of supply; top 100 control 80.58% — moderately concentrated
Sell pressure dominates at 66.9% of 24h volume with 557 sells vs 123 buys

Price Prediction

bearish

Short term

bearish
1–24 hours

After a 92%+ surge, the token is showing early signs of exhaustion. The most recent candle (candle [1]) closed at $0.000719, well below the session high of $0.000837, forming a bearish upper wick. The 5-minute change is already -8.4%. Sell pressure at 66.9% and 557 sells vs 123 buys suggest distribution is underway. A retracement toward the $0.000530–$0.000611 support zone is likely in the near term.

Target low$0.000460
Target high$0.000837
Support: $0.000611 (candle [2] low), $0.000532 (candle [3] open/low), $0.000457 (candle [7] low)
Resistance: $0.000827 (candle [2] high), $0.000837 (candle [1] high — session peak), $0.000806 (candle [1] open)

Medium term

bearish
7–30 days

The 30-day holder trend is structurally declining (-824 holders, -11%), indicating organic interest has been fading prior to this pump. Without sustained buying catalysts or new narrative developments, the token is likely to retrace a significant portion of the pump gains. The FDV of ~$718K–$830K leaves limited upside unless broader market conditions improve dramatically.

Catalysts
  • Renewed trading card narrative or viral social media activity
  • Broader Solana meme coin market rally
  • New exchange listings or partnership announcements
  • Sustained holder growth reversing the 30-day decline

Bullish factors

  • 92%+ 24h price surge with strong momentum in candles [2]–[5]
  • Zero snipers detected — no early-buyer overhang from block-0 sniping
  • Narrative catalyst (1,100% trading card price spike) is attention-grabbing
  • Recent 24h holder count up +41 (+0.57%), suggesting some new entrants
  • Total liquidity of $145.1K is reasonable for a sub-$1M FDV token

Bearish factors

  • 66.9% sell pressure — sellers dominate 24h activity (557 sells vs 123 buys)
  • 30-day holder decline of -824 (-11%) shows structural disinterest pre-pump
  • Top 100 holders control 80.58% of supply — high concentration risk
  • Unverified contract with unknown update authority
  • 5-minute price already down -8.4% from recent high, suggesting distribution
  • Mutable=false but update authority unknown — authority risk cannot be fully assessed
Confidence: medium. Confidence is medium because the 24h price action is clearly pump-driven with strong sell pressure, but the zero-sniper finding and low FDV leave room for continued speculative interest. The 30-day holder decline is a structural bearish signal, but short-term meme momentum is inherently unpredictable.

Deep Analysis

The 23-hour OHLC series reveals a clear pump pattern beginning around candle [20] (~$0.000366) and accelerating sharply through candles [5]–[2], peaking at $0.000837 in candle [2]. The most recent candle [1] (06:00 UTC) opened at $0.000806, hit a high of $0.000837, but closed at $0.000719 — forming a significant bearish upper wick (shooting star-like pattern), suggesting rejection at the highs. Candles [13] and [22]–[23] show near-doji behavior with minimal volume, indicating low-activity consolidation before the pump. Volume spiked dramatically in candles [2] ($18,863) and [3] ($18,476), confirming the pump was volume-backed, but candle [1] volume dropped to $7,108, signaling fading momentum.

Trend

Short-term
uptrend
Medium-term
uptrend

Momentum

Status
overbought

Volume

Trenddecreasing
Buy 33%Sell 67%

The short and medium-term trend is technically an uptrend given the 92%+ 24h gain and series of higher highs from candle [20] to candle [2]. However, the most recent candle shows a bearish reversal signal (shooting star / upper wick rejection at $0.000837), and the 5-minute price is already -8.4%. The uptrend is at risk of reversal.

Key Price Levels

Support
Immediate$0.000661 (candle [3] close)
Major$0.000457 (candle [7] low / pre-pump consolidation zone)
Resistance
Immediate$0.000808 (candle [2] close / candle [1] open)
Major$0.000837 (candle [1] and [2] session high)

Immediate support sits at the candle [3] close of ~$0.000661, which was the prior breakout level. A breach of this level opens a move toward the $0.000457–$0.000490 consolidation zone (candles [7]–[8]). On the upside, $0.000808 is the first resistance (prior candle close), with the session high of $0.000837 as the key level to reclaim for bullish continuation.

Notable patterns

  • Shooting star / bearish upper wick on candle [1] — rejection at session high of $0.000837
  • Volume climax in candles [2]–[3] followed by sharp volume decline — classic pump exhaustion signal
  • Series of higher highs and higher lows from candle [23] to candle [2] — confirmed uptrend now at risk
  • Near-doji candles at [13], [22], [23] with near-zero volume — low-activity base before pump
  • Bearish engulfing risk: candle [1] close ($0.000719) below candle [2] open ($0.000661) open is not confirmed, but upper wick rejection is significant

Total holders7,179
24h Δ+41
7d Δ-5
30d Δ-824
Accelerating Growth
No

Correlation with price

Inverse correlation observed: the 30-day holder decline of -824 (-11%) occurred during a period of price stagnation/decline, while the recent 24h price pump of +92% has attracted a modest +41 new holders in 24h. The holder recovery is minimal relative to the price move, suggesting the pump is not yet translating into sustained new holder acquisition.

The holder trend is structurally declining over the 30-day period, with consistent daily net negative changes throughout April and May 2026. The steepest declines occurred in early May (e.g., -80 on May 4, -71 on May 12, -68 on May 3), with the rate of decline slowing in recent days (-7 on May 25, -3 on May 24). The 7-day change is -5 holders, and the 24h change is +41 — the first meaningful positive reading in the series, likely driven by the 92% price pump attracting new speculators. However, the deceleration in holder losses and the small 24h gain do not yet constitute a trend reversal. The 1-hour gain of +29 holders is notable and may indicate accelerating new interest, but it is too early to confirm a sustained reversal.

Top 10 hold33.96%
Top 100 hold80.58%
Sentiment
Mixed

Notable holders

GBsngTQLDQ6Afv7A4JV6enHz6vHrdzgNC1e45DekQc1L

DEX liquidity pool — this address matches the PumpSwap pair address listed in the price data

11.46%

GGauhvdCyQhDMHB7RV8EBrXHFUX578PjuNJjdApqVFZx

Individual whale or project-affiliated wallet

4.62%

8GYbQxSrjEL1jMhNrUkbw2fVcn46uZEuVrJYyFoueAFe

Individual whale

4.15%

EggQdm5dGNEbdneUcLePwYv19ACmRvP5mwKbkHoHq7mV

Individual whale

2.18%

511wna7SgbLsJ5m33FmnJhamH3qH2sHhmqJTdGmiNACt

Individual whale

2.17%

The top holder at 11.46% (GBsngTQLDQ6Afv7A4JV6enHz6vHrdzgNC1e45DekQc1L) is the PumpSwap liquidity pool address, which is expected and not a concern. Excluding the LP, the next largest holders are at 4.62%, 4.15%, 2.18%, and 2.17% — a relatively distributed set of individual whales. The top 10 (excluding LP) hold approximately 22.5% of supply. The top 100 controlling 80.58% is elevated and indicates significant concentration risk. Holders 6 and 7 both hold exactly 2.00% and holder 16 holds exactly 1.25% (round numbers), which may indicate team/project wallets or structured allocations. Overall distribution is concentrated but not extreme for a meme token of this size.

Liquidity$145,100
Depth
Shallow
Slippage risk
high

Volume (24h)

Buy$30,860
Sell$62,440
Net flow
outflow

Traders (24h)

Unique buyers46
Unique sellers218

Total liquidity of $145.1K on PumpSwap is shallow relative to the FDV of ~$718K–$830K, representing approximately 17–20% of FDV in liquidity. This creates meaningful slippage risk for larger trades. The 24h net flow is clearly negative (outflow): sell volume of $62.44K is more than double buy volume of $30.86K, and unique sellers (218) outnumber unique buyers (46) by nearly 5:1. This strongly suggests distribution into the pump rather than accumulation. The 24h total of 680 transactions (123 buys + 557 sells) with only 236 unique wallets indicates some wallets are executing multiple sell transactions. Market health is poor from a flow perspective despite the price pump, which may be sustained by thin liquidity amplifying price impact of smaller buy orders.

Supply & Valuation

Total supply999,868,747.66
FDV$718,411 (price data) / $829,610 (analytics data)

Authorities

Mint authority
Active
Freeze authority
Active

The token has a total supply of ~999.87M KABUTO with 6 decimals, consistent with a standard PumpFun-style launch. The FDV ranges from $718K to $830K depending on the price source used, indicating a micro-cap token. The metadata shows 'mutable: false', which is a positive signal suggesting the token metadata cannot be changed. However, the update authority is listed as 'unknown', preventing a definitive assessment of mint and freeze authority status. The contract is unverified, which is a risk factor. The token is not flagged as spam. Without confirmed renouncement of mint and freeze authorities, a degree of rug risk remains. Investors should verify on-chain authority status independently via Solana explorers before committing significant capital.

Volatility
high

92%+ price surge in 24 hours on a micro-cap token with $145K liquidity. Extreme volatility is inherent; a retracement of 50%+ from the peak is plausible given the sell pressure and thin liquidity.

Liquidity
high

Total liquidity of $145.1K is shallow for a token with $718K–$830K FDV. Large sell orders will face significant slippage. The liquidity-to-FDV ratio of ~17–20% is low.

Concentration
medium

Top 10 holders control 33.96% of supply (including the LP at 11.46%). Excluding the LP, top 9 non-LP holders control ~22.5%. Top 100 control 80.58%. Several round-number holdings (2.00%, 1.25%) suggest possible team/structured wallets. Concentration is elevated but not extreme for a meme token.

SniperDump
low

Zero snipers detected in the first 1,000 blocks. This eliminates the typical sniper dump risk that plagues many PumpFun launches. No early-block bot wallets are positioned to dump on retail.

Authority
medium

Update authority is 'unknown' and the contract is unverified. While 'mutable: false' is positive, mint and freeze authority status cannot be confirmed from the provided data. This creates residual rug risk that cannot be dismissed.

Key risks

  • Severe sell pressure: 66.9% of 24h volume is sells, with 218 sellers vs 46 buyers — distribution into the pump
  • 30-day holder decline of -824 (-11%) indicates structural loss of community interest
  • Unknown update/mint/freeze authority status — rug risk cannot be fully assessed
  • Shallow liquidity ($145.1K) amplifies both upside and downside price moves
  • Unverified contract with no audit trail
  • Micro-cap FDV ($718K–$830K) subject to extreme manipulation by large holders

Mitigating factors

  • Zero snipers in first 1,000 blocks — no sniper overhang
  • Mutable: false — metadata cannot be altered
  • Narrative catalyst (1,100% trading card price spike) provides short-term attention
  • Reasonable liquidity-to-FDV ratio for a PumpFun token (~17–20%)
  • No spam flag from data providers
  • 24h holder count up +41, suggesting some new organic interest
Suitable for: Suitable only for high-risk-tolerant speculators with small position sizes relative to their portfolio. Not suitable for conservative or moderate-risk investors. Any position should be sized assuming total loss is possible. This is a micro-cap meme token with unverified contracts, unknown authority status, and dominant sell pressure following a pump.

KABUTO is a narrative-driven Solana meme token that has experienced a sharp 92%+ pump on the back of a trading card price spike story. The zero-sniper launch is a genuine positive, but the structural 30-day holder decline, dominant sell pressure, shallow liquidity, and unknown authority status make this a high-risk speculative play. The token is best characterized as a short-term momentum trade rather than a long-term investment.

Bull case (low)

If the trading card narrative gains viral traction on social media (Twitter/X) and attracts a new wave of buyers, KABUTO could sustain or extend the pump toward the $0.000837 session high and potentially beyond, targeting $0.0010–$0.0012 (a new ATH). A reversal of the holder decline trend would confirm genuine community building.

  • Viral social media amplification of the trading card narrative
  • Broader Solana meme coin market rally lifting all boats
  • New exchange listings or influencer endorsements
  • Sustained holder growth reversing the 30-day decline
  • Zero sniper overhang means no forced selling from early bots

Base case

KABUTO consolidates in the $0.000530–$0.000720 range over the next 1–7 days as the pump partially retraces. Some new holders attracted by the pump remain, partially offsetting the ongoing holder decline. The token maintains its PumpSwap listing with $100K+ liquidity but fails to break the $0.000837 session high without a new catalyst.

  • Sell pressure moderates as weak hands exit and a new equilibrium is found
  • The trading card narrative provides intermittent social media attention
  • No rug pull or authority-related exploit occurs
  • Broader Solana market remains stable

Bear case (high)

The pump fades as sell pressure continues to dominate. With 218 sellers vs 46 buyers and $62.44K in sell volume vs $30.86K in buy volume, the token retraces 50–70% from the session high back toward the $0.000370–$0.000460 pre-pump range. The 30-day holder decline resumes, and the narrative fades without sustained catalysts.

  • Dominant sell pressure (66.9%) and 5:1 seller-to-buyer ratio
  • 30-day structural holder decline showing pre-existing community attrition
  • Shallow liquidity amplifying downside moves
  • Unknown authority status creating latent rug risk
  • Unverified contract limiting institutional or informed retail participation

GeneratedMay 26, 06:17 AM
Data freshnessPrice and OHLC data current as of 2026-05-26T06:00:00Z. Holder data current as of 2026-05-25T00:00:00Z (daily series). Sniper data covers first 1,000 blocks from launch.
Model confidence
medium

Data sources

  • On-chain Solana token metadata (Mint: A9E2AopuG56LWYiXsvGLLTcLjUjQ539PY6k5Fhfepump)
  • PumpSwap DEX price and liquidity data (Pair: GBsngTQLDQ6Afv7A4JV6enHz6vHrdzgNC1e45DekQc1L)
  • Hourly OHLC candle data (23 candles, USD-denominated)
  • 24h trading analytics (buy/sell volume, unique wallets)
  • Holder metrics and distribution data (7,179 total holders)
  • 30-day historical holder series (daily)
  • Top 20 holder addresses and balances
  • Sniper analysis (first 1,000 blocks)

Limitations

  • Update authority, mint authority, and freeze authority status are unknown — rug risk cannot be fully quantified
  • Sniper data covers only the first 1,000 blocks; later accumulation by sophisticated actors is not captured
  • No audit or contract verification data available
  • FDV discrepancy between price data ($718K) and analytics data ($830K) — likely due to price feed timing differences
  • Historical holder data only goes back 30 days; full holder history since launch is unavailable
  • No on-chain transaction-level data for individual wallet behavior beyond top 20 holders
  • Social sentiment data limited to Twitter/Moralis links — no quantitative social metrics provided

This analysis is for informational purposes only and does not constitute financial advice. Cryptocurrency investments, especially micro-cap meme tokens, carry extreme risk including total loss of capital. Always conduct your own research and consult a qualified financial advisor before making investment decisions.

Token Info

ChainSolana
Contract
Total Supply999,868,747.66

Key Risks

Severe sell pressure: 66.9% of 24h volume is sells, with 218 sellers vs 46 buyers — distribution into the pump
30-day holder decline of -824 (-11%) indicates structural loss of community interest
Unknown update/mint/freeze authority status — rug risk cannot be fully assessed
Shallow liquidity ($145.1K) amplifies both upside and downside price moves

Smart Money & Sniper Analysis

high confidence
High risk

No snipers were detected in the first 1,000 blocks of KABUTO's launch. This is a notable positive signal, as it means there is no early-buyer sniper overhang that could dump on retail participants. The absence of snipers suggests either a fair launch or that the token launched without attracting bot activity. However, with 66.9% sell pressure and 218 unique sellers vs 46 unique buyers in the past 24h, current holders (likely acquired via swap — 6,096 of 7,179 holders) appear to be distributing into the pump.

AI-generated insight. Not financial advice.

Sniper details

Sniper concentration0.00%
PnL stateUnknown
Sell-through rateUnknown
Profit-taking risk
high

0 snipers detected in the first 1,000 blocks — no sniper concentration

Cannot be determined from sniper data as no snipers were present. However, the 30-day holder decline of -824 suggests many early holders have already exited. The current pump may be attracting new speculative buyers while older holders distribute.

Frequently Asked Questions

What is the price prediction for Kabuto (KABUTO)?

After a 92%+ surge, the token is showing early signs of exhaustion. The most recent candle (candle [1]) closed at $0.000719, well below the session high of $0.000837, forming a bearish upper wick. The 5-minute change is already -8.4%. Sell pressure at 66.9% and 557 sells vs 123 buys suggest distribution is underway. A retracement toward the $0.000530–$0.000611 support zone is likely in the near term. Short-term outlook is bearish (1–24 hours), with a target range of $0.000460 to $0.000837.

Is KABUTO a safe investment on Solana?

Overall risk is rated high with a risk score of 7.5/100. Suitable only for high-risk-tolerant speculators with small position sizes relative to their portfolio. Not suitable for conservative or moderate-risk investors. Any position should be sized assuming total loss is possible. This is a micro-cap meme token with unverified contracts, unknown authority status, and dominant sell pressure following a pump.

How are KABUTO holders trending?

Kabuto currently has 7,179 holders and is declining (24h: 41, 7d: -5, 30d: -824). The holder trend is structurally declining over the 30-day period, with consistent daily net negative changes throughout April and May 2026. The steepest declines occurred in early May (e.g., -80 on May 4, -71 on May 12, -68 on May 3), with the rate of decline slowing in recent days (-7 on May 25, -3 on May 24). The 7-day change is -5 holders, and the 24h change is +41 — the first meaningful positive reading in the series, likely driven by the 92% price pump attracting new speculators. However, the deceleration in holder losses and the small 24h gain do not yet constitute a trend reversal. The 1-hour gain of +29 holders is notable and may indicate accelerating new interest, but it is too early to confirm a sustained reversal.

What does sniper activity look like for KABUTO?

Snipers hold roughly 0.00% of supply with PnL state "unknown" and sell-through rate "unknown". Profit-taking risk: high.

What are the key risks of holding KABUTO?

Severe sell pressure: 66.9% of 24h volume is sells, with 218 sellers vs 46 buyers — distribution into the pump • 30-day holder decline of -824 (-11%) indicates structural loss of community interest • Unknown update/mint/freeze authority status — rug risk cannot be fully assessed

Track KABUTO