Perico6 min read
The Price Action Framework That Changes Everything
How Stripping Back to Pure Price Action Eliminates Trading Noise and Delivers Clarity
AI summary of “Once You Master Price Action, Trading Becomes Ridiculously Simple”
The retail trading trap is well-documented: add more indicators, refine the analysis, search for the perfect signal. Yet most traders continue losing money, trapped in a cycle of complexity that obscures rather than reveals market direction. The solution isn't more data—it's reading price action with brutal simplicity.
The Indicator Trap
The classic pattern repeats across retail trading accounts: Two indicators signal buy, another flashes sell. A trade gets entered. Price immediately moves against the position. The response? Add another indicator to capture that missed move. The chart becomes cluttered, the framework underneath the decision-making process remains absent, and every trade becomes a guess dressed up as analysis.
The best traders aren't looking at more—they're looking at less of the right thing.
"Simple does not mean easy. Each time you enter a trade, you're fully accepting that the market can move against you and that you could lose that trade. That doesn't make the trade wrong."
The goal isn't risk elimination—it's building a repeatable strategy that generates results over time. No magical indicator exists that will prevent all losses. The pursuit of such a tool is the pursuit of a mirage.
The Sunk Cost Fallacy in Trading
A revealing moment of clarity often arrives after hours of complex analysis lead to consecutive losing trades. The psychological trap: continuing to execute trades based on analysis not because it makes sense, but because so much time was invested building it.
This is the sunk cost fallacy—when time or effort invested creates an elevated sense of value even when contradictory to the actual goal of taking successful trades.
The breakthrough comes from stripping everything away. Drawing one simple line. Recognizing trades were being executed in the complete opposite direction to what made sense. Placing a simple trade following basic analysis—a decision taking seconds rather than hours—and watching it reach full profit.
The lesson: Simplicity is key.
Understanding What Charts Actually Show
A chart is a visual representation of mass human psychology. It reveals:
- When buyers are in control
- When sellers are in control
- Points where the market is close to confirming buyer control or indicating sellers may take control
This information is always present. But indicators and noise bury it under layers of confusion.
The Three-Key Framework
The approach distills to three components that reveal market direction and entry points:
1. Direction
Zoom out. Look at the complete picture over several days. Establish a trend. Most traders view charts as random moves up and down, reacting to every tick. But the market isn't random—it shows where buyers step in, where sellers step in, and where each group is likely to return.
Finding the trend:
- Wait for an initial push up or down
- In an uptrend: Look for a higher high, followed by a higher low, then a new higher high
- When the second higher high forms, this creates a break of structure—price pushes through the initial high
- Draw a trend line from the first low to the second low before the break of structure
- This confirms market direction and where buyers are likely to step back in
For downtrends, the process mirrors in reverse: initial push down, lower high, new lower low (marking the break of structure), establish the trend line, and anticipate where sellers are likely to return.
2. Confirmation
Confirm levels, don't predict them. Buying because price might bounce at a certain level is catching the falling knife. The alternative: wait for the market to turn around, respect key levels that validate the overall idea, then place trades on confirmation.
Once trend direction, breaks of structure, and the lower level of the trend are established, wait for a response. Use this as indication that buyers may step back in, then position to take advantage if the move continues.
"The trend is your friend. You want to follow the trend."
Fair Value Gaps provide additional confirmation:
- A bullish fair value gap: Three candles where the first candle's high wick doesn't overlap with the low wick of the third candle, leaving space between
- A bearish fair value gap: The first candle's wick low doesn't overlap with the wick high of the third candle
- These gaps represent areas where fair value determination hasn't been proven due to a momentum move
- If momentum continues and that fair value is determined, price can continue moving off that level
When key levels align with bullish or bearish fair value gaps following the trend direction, potential response areas can be identified using only simple price action—no indicators required.
3. Invalidation
When the market begins reflecting that sellers could take control of an uptrend, it presents a unique opportunity. It's the first sign the current move could be falling apart, indicating a new trend in the opposite direction may be developing—one that can be caught early.
When price responds to a buy zone but then breaks and closes below it, this is a break and retest. Typically, when price tests the opposite side of the same level it previously respected, that's often the last point before the market continues in the opposite direction.
Full confirmation comes via a change of character—the opposite signal to the earlier break of structure. Price fails to make a new high, breaks underneath the previous low, comes up to test the opposite side of that trend level, then continues downward.
The cycle then repeats. After the break of structure, the same analysis applies, the same signals emerge, and trades follow the new market direction.
The Entry Model: Zooming Into Precision
Context matters. One single chart timeframe isn't the complete answer. The framework described above establishes the overall picture—the route map showing the start point and end destination. But actual trade execution requires dropping into a lower timeframe.
Think of it this way: The broader analysis is the complete route map. The one-minute entry model is the turn-by-turn directions to reach the final destination.
The framework combines:
- 15-minute timeframe for the three-key concept (Direction, Confirmation, Invalidation)
- 1-minute timeframe for the entry model
One-Minute Entry Model:
- New York session open: Volume floods into the market
- Change of character: Price breaks out of the current trend, creating the first initial push up
- Fair value gap: Wait for a gap in the direction of that change of character—this becomes the target area
- Entry execution: Wait for price to pull back into that fair value gap. Enter right in the middle of the gap
- Risk management: Place stop loss outside the fair value gap producing candle
- Target: Three to four times the risk off the entry, allowing the trade to play out
The result: A simple view of the larger picture with key hotspots on the chart, paired with simple three-step entry criteria. All indicators stripped away. Wait for response. Place trades with complete clarity.
The Framework in Action
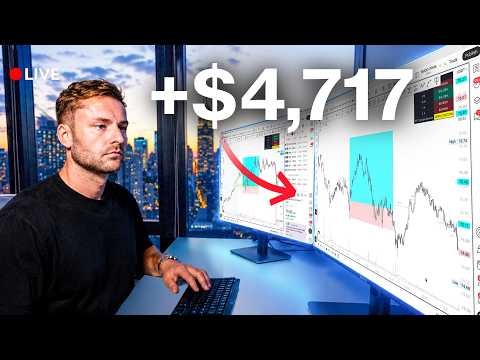
This isn't theoretical. Real-time execution of this exact framework—marking out levels, executing the entry model, allowing trades to run—has produced results of four to five times the risk on individual trades.
The biggest insight about reading price action isn't about having a perfect strategy. It's about:
- Following the overall move
- Being precise about entries
- Executing the same simple, repeatable model over and over
The goal isn't predicting or guessing. It's analyzing with clarity and executing strategy.
The Path Forward
The retail trading industry has buried simple price action reading under a thousand different indicators and overcomplicated analysis. Strip all of that back and what remains is ridiculously simple—but only if you understand what to look at.
Good trades become obvious. Bad trades look stupid. The market stops appearing as random noise and starts revealing itself as human psychology in motion, with clear points where buyers and sellers take control.
The framework isn't complex. But it requires discipline, patience, and the willingness to abandon the sunk cost of previous complicated systems. The traders who become profitable all eventually reach the same conclusion: Stop trying to guess and predict. Start reading.
Written by AI from the video's transcript. It can compress, misattribute or miss context — the original video is the source. Not investment advice.