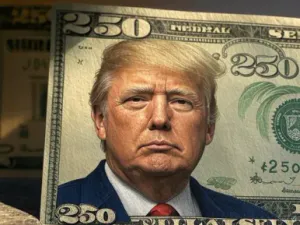
$250

TRUMPBILL Price Today & AI Analysis

$250SolanaAnalysis as of May 28, 2026

Price

$0.041201

-1.95% 24h · FDV $11,985

Contract

Live
7nEx3cF6bgD2LDh3MimokRPbAV97TFsGKQyjRKN7pump

Chain

Holders

3,331

Market cap

$11,985

More tokens on Solana

TRUMPBILL: holders, selling & liquidity

2026-05-28 21:17 UTC

Holder addresses

3,639

Top 10 supply share

Not available

Reported liquidity

Not available
How concentrated is TRUMPBILL ownership?
Top-10 ownership concentration is not available in this report. The saved holder count is 3,639 addresses (2026-05-28 21:17 UTC). A holder count alone does not establish how supply is distributed.
Are large holders selling TRUMPBILL?
This report cannot establish whether large holders are selling: it does not include wallet-level holder balances over time matched to swaps. A complete buy/sell volume observation is not available in the saved inputs. A large swap alone does not identify a large holder, and a transfer alone does not prove a sale.
Is TRUMPBILL liquidity falling?
Liquidity is not available in the saved inputs. At least two timestamped liquidity observations are needed to establish a change; this report does not have them.
Sources, observations & limitations

Source: inputs saved with the report generated 2026-05-28 21:17 UTC. Original provider retrieval times and historical samples were not recorded. Legacy zero placeholders are treated as unavailable. Holder addresses are not unique people. The provider’s top-10 share is not adjusted here for pools, exchanges, burn addresses or related wallets. Sniper classifications and wallet-level holder history are unavailable. Inspect token on the block explorer.

Recent swap evidence

Swap evidence is unavailable for this report.

Ask Unhosted AI about $250

Continue in chat

Report snapshot

as of May 28, 09:17 PM UTC

FDV

$67,998

Liquidity

Not available

Holders

3,639

Snipers

Not available

Risk

Very High
Loading price chart…

AI Executive Summary

Risk

Very High

Sentiment

Bearish

TRUMPBILL ($250) is a Solana meme/political token launched on the pump.fun launchpad (mint ending in 'pump'), currently trading at $0.0000681 with a fully diluted valuation of ~$68K. The token has experienced an extraordinary 382.89% price surge in the past 24 hours, driven by a sharp spike in the most recent candles. Total supply is ~998.5M tokens. The token has no verified contract, no description, and its update authority is a non-renounced third-party address, raising governance concerns. Liquidity reported on-chain is $0.00, which is a critical red flag. Holder count stands at 3,639 with a sudden +313 new holders in the past 24 hours — coinciding exactly with the price pump.

Key points

  • Extreme 382.89% 24h price surge on very low absolute liquidity
  • Zero reported on-chain liquidity ($0.00) despite active trading on Raydium
  • Top 10 holders control 45.13% of supply; top 100 control 86.1% — highly concentrated
  • No snipers detected in first 1,000 blocks — clean launch mechanics
  • Holder base was completely flat for 30 days before a sudden +313 spike today, perfectly correlated with the pump
  • Pump.fun origin token with political/meme theme (Trump Bill / $250)

AI Price Analysis

bearish

Short term · 1–24 hours

bearish

After a 382.89% surge in 24h, the token is at extreme risk of a sharp mean-reversion. The most recent candle (20:00 UTC) shows a high of $0.0000949 with a close of $0.0000739, forming a bearish upper wick — a classic shooting star / topping signal. With $0.00 reported liquidity and only 158 unique wallets trading, any sell pressure could cause catastrophic slippage. Short-term bias is strongly bearish.

Target low

$0.000024

Target high

$0.000095

Support

$0.000043 (candle [3] close / prior resistance), $0.000026 (candle [7] open area), $0.000018 (candle [8] open / candle [9] high)

Resistance

$0.000073 (candle [1] close), $0.000095 (candle [1] all-time high in dataset)

Medium term · 1–4 weeks

bearish

The token showed zero meaningful holder growth for the entire 30-day period prior to today's pump, suggesting no organic community development. With $68K FDV, near-zero liquidity, extreme concentration, and a meme/political theme with no utility or description, sustained price appreciation is unlikely. A reversion toward pre-pump levels (~$0.000014–$0.000024) is the base expectation.

Catalysts

  • Broader Trump-related political news cycle could briefly reignite interest
  • Listing on a DEX aggregator or minor exchange could attract new buyers
  • Coordinated social media campaign by holders

Bullish factors

  • Strong momentum: +382.89% in 24h with buy pressure at 56.7%
  • 329 buys vs 185 sells — net positive order flow
  • No snipers detected — no early predatory wallets waiting to dump
  • Holder count surged +313 (8.6%) in 24h, showing new interest

Bearish factors

  • $0.00 reported on-chain liquidity — extreme slippage risk
  • Top 10 hold 45.13%, top 100 hold 86.1% — severe concentration
  • Token was completely flat for 30 days before today's pump — no organic growth
  • No verified contract, no description, mutable metadata authority not renounced
  • FDV of only ~$68K — micro-cap with minimal market depth
  • Shooting star candle pattern at recent high ($0.0000949) signals exhaustion

Confidence: low. Confidence is low due to: (1) $0.00 reported liquidity making price discovery unreliable, (2) extremely thin trading with only 158 unique wallets, (3) meme token dynamics are inherently unpredictable, and (4) the 24h price change field shows 0% while the 6h shows +200%, suggesting data inconsistency that undermines reliable modeling.

Token Info

Chain
Solana
Contract
7nEx3c...pump
Total Supply
998,471,658.97

Key Risks

  • Zero reported on-chain liquidity — extreme exit risk
  • Top 10 holders control 45.13% — coordinated dump could be catastrophic
  • Shooting star candle at $0.0000949 high suggests price exhaustion
  • Holder growth entirely driven by today's pump — no organic community

Smart money & sniper coverage

Sniper classifications and wallet-level trading histories are not available in this report. Sniper concentration, profit-taking and dump risk have not been assessed.

Deep Analysis

The 9-hour OHLC dataset reveals a powerful but potentially exhausted uptrend. Starting from a low of $0.0000141 at candle [9] (12:00 UTC), the price made a series of higher highs and higher lows through candle [3] (18:00 UTC, close $0.0000433). Candles [4]–[7] show a brief consolidation/slight pullback between $0.0000238–$0.0000266. Candle [8] (13:00 UTC) was a strong bull engulfing candle, opening at $0.0000188 and closing at $0.0000268 with a wide range. The most recent candle [1] (20:00 UTC) is the most significant: it opened at $0.0000594, surged to a high of $0.0000949, but closed at $0.0000739 — forming a prominent upper wick (shooting star / bearish pin bar), suggesting sellers stepped in aggressively near the high. Volume on candle [1] was $9,069 — the highest in the dataset — confirming the move was real but also potentially a blow-off top.

Trend

Short-term

Uptrend

Medium-term

Uptrend

The short and medium-term trend within this 9-hour window is clearly an uptrend with a series of higher highs (from $0.0000141 to $0.0000949) and higher lows. However, the shooting star candle at the top and the gap-up open of candle [1] suggest the trend may be at an inflection point.

Momentum & Volume

Momentum

Overbought

Volume trend

Increasing

Buy

57%

Sell

43%

Key Price Levels

Immediate support

$0.000043 (candle [3] close, prior breakout level)

Major support

$0.000018 (candle [8] open / candle [9] high area)

Immediate resistance

$0.000073 (candle [1] close)

Major resistance

$0.000095 (candle [1] all-time high in dataset)

The $0.000043 level is the first meaningful support, representing the prior consolidation high before the final leg up. A break below this would likely see a rapid move to $0.000018–$0.000026. On the upside, $0.000073 (the candle [1] close) is now immediate resistance, with the session high of $0.000095 as the key level to reclaim for continuation.

Notable patterns

  • Shooting star / bearish pin bar on candle [1] — upper wick from $0.0000739 close to $0.0000949 high signals seller dominance at the top
  • Parabolic advance: 9 consecutive hours of higher highs from $0.0000141 to $0.0000949 (+572% from low to high)
  • Bull engulfing candle at candle [8]: opened $0.0000188, closed $0.0000267, engulfing prior candle range
  • Gap-up open on candle [1]: opened at $0.0000594 vs prior close of $0.0000543 — momentum gap
  • Volume climax on candle [1]: highest-volume candle coincides with bearish wick — potential blow-off top

Liquidity

Liquidity

Not available

Depth

Not assessed

Slippage risk

Not assessed

Liquidity depth and slippage risk cannot be assessed without a liquidity observation.

Supply & authorities

Total supply

998,471,658.97

FDV

$67,997.70

Mint authority

Not available

Freeze authority

Not available

Mint and freeze authority checks are not included in the saved provider observations. Metadata update authority does not establish either permission.

  • Volatilityhigh

    382.89% gain in 24 hours with a parabolic move from $0.0000141 to $0.0000949 in 9 hours. Extreme volatility typical of micro-cap meme tokens. A reversion of 80%+ from peak is common after such moves.

  • LiquidityNot assessed

    A liquidity observation is not available in the saved inputs.

  • ConcentrationNot assessed

    Ownership concentration cannot be assessed without a measured supply distribution.

  • Sniper DumpNot assessed

    Sniper classifications and wallet trading histories are unavailable.

  • AuthorityNot assessed

    Contract or authority checks are not included in the saved provider observations.

Key risks

  • Zero reported on-chain liquidity — extreme exit risk
  • Top 10 holders control 45.13% — coordinated dump could be catastrophic
  • Shooting star candle at $0.0000949 high suggests price exhaustion
  • Holder growth entirely driven by today's pump — no organic community
  • No utility, no description, no verified contract — pure speculative meme token
  • Micro-cap FDV of $68K makes this susceptible to manipulation
  • Update authority not renounced — metadata change risk

Mitigating factors

  • No snipers in first 1,000 blocks — clean launch
  • Net buy pressure: 56.7% buys vs 43.3% sells in 24h
  • 329 buy transactions vs 185 sell transactions — more buyers than sellers
  • Token marked mutable:false — some metadata protection
  • Pump.fun launch provides standardized tokenomics (1B supply)
  • Positive net inflow: $23.36K buys vs $17.81K sells

Suitable for

Suitable ONLY for highly experienced, risk-tolerant speculators who understand they could lose 100% of their investment. This token exhibits nearly every characteristic of a high-risk micro-cap meme token: near-zero liquidity, extreme concentration, parabolic price action, no utility, and no verified contract. Position sizing should be minimal (treat as lottery ticket). Not suitable for retail investors, long-term investors, or anyone who cannot afford total loss.

TRUMPBILL ($250) is a political meme token on Solana that has experienced a violent 382.89% pump in 24 hours, driven by FOMO buying from 313 new wallets. The token has no utility, near-zero liquidity, extreme holder concentration, and was completely dormant for 30 days before today's event. The risk/reward is highly asymmetric to the downside at current prices. The only viable thesis is a short-term momentum trade with strict risk management, not a fundamental investment.

Scenario Analysis

Bull Case

Low probability

Continued momentum and viral spread: If the Trump Bill political narrative gains traction on social media (Twitter/X, Telegram), the token could attract a broader wave of retail buyers, pushing the FDV from $68K toward $500K–$1M+ as seen with similar political meme tokens. The clean launch (no snipers) and net positive order flow support a continuation scenario in the very short term.

  • Viral social media spread of the Trump Bill narrative
  • Broader Solana meme season momentum
  • Whale accumulation rather than distribution at current levels
  • Sustained buy pressure above $0.000073 resistance

Base Case

Volatile consolidation followed by gradual decline: The token consolidates between $0.000043–$0.000073 for 24–72 hours as some profit-taking occurs, then gradually drifts lower toward $0.000024–$0.000043 over the following week as the narrative fades and new buyers dry up. FDV settles in the $24K–$43K range.

  • Some liquidity exists despite $0.00 report (data artifact)
  • Whale holders partially distribute but don't fully dump
  • No major new catalysts emerge to reignite buying
  • Holder count stabilizes around 3,500–3,700 after initial FOMO subsides

Bear Case

High probability

Pump-and-dump collapse: The parabolic move reverses sharply as early buyers (who entered at $0.000014–$0.000024) take profits. With $0.00 reported liquidity, even modest selling pressure causes cascading price drops. The token returns to pre-pump levels of $0.000014–$0.000024, representing an 65%–80% decline from current price. Holder count stabilizes or declines as FOMO buyers exit at a loss.

  • Zero reported liquidity amplifies sell pressure
  • Shooting star candle signals distribution at the top
  • Top 10 whale concentration (45.13%) creates dump overhang
  • No fundamental utility to support price at elevated levels
  • Historical 30-day stagnation suggests no organic demand base

Analysis details

Generated

May 28, 09:17 PM UTC

Saved observation

2026-05-28 21:17 UTC

Model confidence

Low

Data sources

  • Moralis on-chain metadata API
  • Raydium DEX pair data (pair HWNjtD1X6bqxH8xjfnHHbHQ5FWJfz4JKf8hw17QeisDj)
  • On-chain holder metrics and distribution data
  • Hourly OHLC candle data (9 candles, USD-denominated)
  • 24h trading analytics (buy/sell volume, unique wallets)
  • Historical daily holder count series (30 days)
  • Sniper analysis (first 1,000 blocks)
  • Top 20 holder addresses and balances

Limitations

  • Total liquidity reported as $0.00 — this may be a data lag or reporting error, but cannot be confirmed; all liquidity-dependent analysis is therefore unreliable
  • Mint and freeze authority status not explicitly provided — inferred from available metadata only
  • Only 9 hourly candles available — insufficient for robust technical analysis or trend confirmation
  • Sniper data shows 0 snipers but total sniped USD and transactions are 'unknown' — cannot fully validate
  • 24h price change shows 0% in the price change table but 382.89% in the price section — data inconsistency noted
  • No social media metrics, developer activity, or fundamental data available
  • Top holder classifications are inferred from address patterns, not confirmed on-chain labels
  • FDV of $0.00 in trading analytics conflicts with $67,997.70 in metadata — data inconsistency noted

How we keep this honest

Every directional call on these pages is recorded before the outcome is known and scored on our public prediction track record. We apply the same standard to others: our audit of 1,581 crypto YouTube predictions found bullish calls did worse than random timing, and our memecoin pump anatomy study measured what chasing a pump actually costs.

This analysis is for informational purposes only and does NOT constitute financial advice. Cryptocurrency investments, especially micro-cap meme tokens, carry extreme risk including total loss of capital. Past price performance is not indicative of future results. Always conduct your own research (DYOR) before making any investment decisions.

Frequently Asked Questions

How concentrated is TRUMPBILL ownership?

Top-10 ownership concentration is not available in this report. The saved holder count is 3,639 addresses (2026-05-28 21:17 UTC). A holder count alone does not establish how supply is distributed.

Are large holders selling TRUMPBILL?

This report cannot establish whether large holders are selling: it does not include wallet-level holder balances over time matched to swaps. A complete buy/sell volume observation is not available in the saved inputs. A large swap alone does not identify a large holder, and a transfer alone does not prove a sale.

Is TRUMPBILL liquidity falling?

Liquidity is not available in the saved inputs. At least two timestamped liquidity observations are needed to establish a change; this report does not have them.

What is the short-term price outlook for TRUMPBILL ($250)?

After a 382.89% surge in 24h, the token is at extreme risk of a sharp mean-reversion. The most recent candle (20:00 UTC) shows a high of $0.0000949 with a close of $0.0000739, forming a bearish upper wick — a classic shooting star / topping signal. With $0.00 reported liquidity and only 158 unique wallets trading, any sell pressure could cause catastrophic slippage. Short-term bias is strongly bearish. Short-term outlook is bearish (1–24 hours), with a target range of $0.000024 to $0.000095.

Is $250 a safe investment on Solana?

The AI assessment rates overall risk as very high with a risk score of 9.1/100. Suitable ONLY for highly experienced, risk-tolerant speculators who understand they could lose 100% of their investment. This token exhibits nearly every characteristic of a high-risk micro-cap meme token: near-zero liquidity, extreme concentration, parabolic price action, no utility, and no verified contract. Position sizing should be minimal (treat as lottery ticket). Not suitable for retail investors, long-term investors, or anyone who cannot afford total loss.

What are the key risks of holding $250?

Zero reported on-chain liquidity — extreme exit risk • Top 10 holders control 45.13% — coordinated dump could be catastrophic • Shooting star candle at $0.0000949 high suggests price exhaustion

← Back to all predictions

Track $250