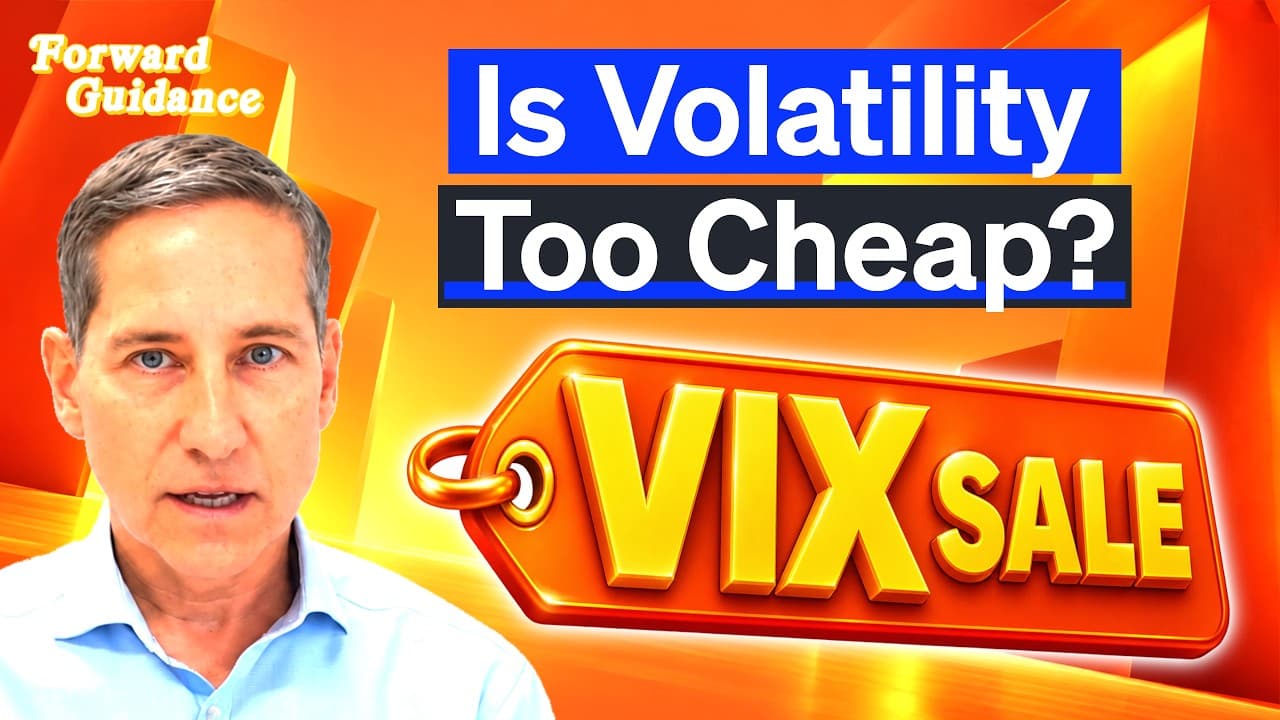
🎯 When Correlation Breaks: The Case for Tail Hedging in 2025
The derivatives market is flashing signals that haven't been seen in decades. Stock correlations have collapsed to unprecedented lows, volatility remains subdued despite mounting macro uncertainty, and the setup for tail hedging looks increasingly compelling. Dean Kerna, CEO of Macro Risk Advisors and host of the Alpha Exchange podcast, breaks down why this moment represents one of the most fascinating intersections of market structure and policy risk in years.
📊 The Correlation Anomaly: A Market With No Historical Precedent
The most striking feature of today's market isn't what's happening—it's what isn't happening. Realized correlation among S&P 500 stocks has been trending between 10% and 15% over the past year and a half, with brief periods approaching zero. To understand how extreme this is, consider that in a benign market environment historically, correlation typically ran at 35-40%. During crisis periods like the Global Financial Crisis, the sovereign debt crisis of 2011, or even LTCM, correlations spiked to 75-90%.
This disconnect manifests in remarkable ways. During one period roughly a month ago, the one-month realized volatility of the top 10 S&P stocks hit 45%, while the S&P index itself registered just 7.5% volatility—a 40-point spread that has no historical comparison. In one striking example, Microsoft's correlation to the other Mag Seven stocks actually turned negative during this window.
"It's hard to even overstate how unusually low these numbers are. You haven't put all your eggs in one basket—they're not only not in one basket, they're not even in the same neighborhood."
This extraordinary diversification has been a windfall for index investors, effectively suppressing index-level volatility through pure mathematical offset. But it also creates risk: markets build trades around the expectation that recent patterns will continue, often at precisely the wrong time.
🔄 What's Driving the Disconnect?
Two competing explanations emerge for this structural shift, and both likely play a role:
The Market Structure Hypothesis: Quantitative Investment Strategies (QIS) products offered by major banks have proliferated, with most structures embedding short correlation exposure. These over-the-counter derivatives—invisible in listed options markets—package complex risk exposures delivered via total return swaps. The carry trade has been successful, leading to expanded positioning. The question: is realized correlation low because these products are forcing it lower, or are the products simply responding to an already-low correlation environment?
The Fundamental Hypothesis: Since the 2022 tightening cycle concluded in early 2023, economic data has been relatively stable. Stable growth environments tend to produce lower volatility and reasonably low correlation. Additionally, the AI ecosystem has created distinct subcategories within the market—hyperscalers versus picks-and-shovels, capex models versus free cash flow generation—leading to genuinely divergent stock performance even within similar sectors.
But neither explanation fully accounts for the magnitude of the collapse. Even within the AI space, stocks remain remarkably uncorrelated. The current market high during brief shock episodes might reach 35% correlation—a level that used to represent the average during calm periods.
⚠️ Echoes of Vol-mageddon and the Insurance Premium
The setup bears some resemblance to February 2018's vol-mageddon, when short-volatility products like XIV were effectively wiped out. But there are key differences. The 2018 event had very specific mechanics: the reaction function of those ETFs was mathematically predetermined, requiring 2x the daily move on VIX futures starting from a front-month level around 12. The math was clear—a move from 12 to 18 meant a 100% loss given the 2x leverage.
Today's correlation carry trade operates differently but shares a fundamental characteristic: it's based on selling financial market insurance. The entire insurance model—whether Geico, Swiss Re, or volatility risk premium strategies—depends on collecting premiums most of the time while accepting occasional large payouts. The key is sizing positions appropriately so that when the inevitable risk event occurs, capital remains to reinvest at more attractive levels.
"If you bought a house and the bank asked for proof of homeowners insurance, you'd call the insurance company. If they said 'no premium, nothing'—you'd probably hang up the phone because it can't be real. There's no way you could buy insurance for free. And it's the same in financial markets."
📉 Evaluating Options Attractiveness: Past, Present, and Future
There are three lenses through which to assess whether options represent value:
The Past: Implied volatility sits in extremely low percentiles relative to history. Looking at windows since the 2022 tightening cycle, the VIX and its cross-asset proxies (MOVE index for Treasuries, CVIX for currencies, credit spreads and credit vol) have been trading in approximately the 10th-15th percentile. An index combining these five metrics confirms the picture: volatility measures across asset classes are historically depressed.
The Present: Despite low absolute levels, implied volatility isn't necessarily cheap relative to current realized volatility—which is what actually sets prices. The marginal price setter of vol is the quant at Jane Street or Citadel who replicates options by trading the underlying. With the VIX around 16.5-17 while one-month realized volatility sits at 9, the spread suggests implied vol is actually fair or even slightly rich relative to carry. Market makers won't bid up option prices significantly when realized vol remains benign, regardless of doomsday narratives.
The Future: This is where the opportunity emerges. While impossible to predict with certainty, the totality of uncertainty facing markets appears significantly elevated relative to what's priced. Multiple structural risks could induce sharp increases in realized volatility—and when that happens, implied vol will follow.
🌐 The Uncertainty Landscape: Geopolitics, Rates, and AI Capex
Several intersecting risks create potential catalysts for correlation and volatility to normalize higher:
Energy and Monetary Policy: Geopolitical tensions have directly impacted crude oil—an asset with extensive knock-on effects through plastics, fertilizer, and transportation costs. Rising gas prices complicate the Fed's inflation fight at precisely the wrong time, creating cross-currents between rate policy and economic reality.
The Bond Market as Risk Asset: The traditional risk-off playbook—stocks down, bonds up—has inverted. In recent months, the US racked up $860 billion in new debt in just four months, during peacetime with 4% unemployment and record stock prices. The 10-year yield hitting 5% reflects genuine concern about fiscal sustainability, not just growth expectations. Treasury Secretary Bessent's recent rhetoric, dismissing concerns and implying inside information about bond market movements, adds political risk to an already fraught situation.
"The 10-year note is the risk asset right now, and it's not behaving well at a time when the politics of deficits are intractable."
The AI Capex Paradox: Hyperscalers face a unique dynamic where 6-7% funding costs represent cheap options on potential right-tail outcomes from AI investment. This creates a policy dilemma: rates restrictive enough to cool mortgage demand may still be too low to slow the capex cycle driving economic activity. Meanwhile, the weekend's unusual development—OpenAI's CEO and others calling for the industry to slow down ahead of a massive IPO—highlights the uncertainty even insiders feel about the sustainability of current trajectories.
💡 The Case for Systematic Tail Hedging
Given this backdrop, the argument for systematic long-volatility positioning becomes compelling:
- Historic low correlation is suppressing index volatility through diversification that may prove temporary
- Top 7-8 stocks comprise over 35% of the S&P—if they experience a correlation event where they move together, index-level impact will be severe
- Implied volatility is low relative to history but fair relative to current realized vol, creating asymmetry if realized vol normalizes higher
- Multiple macro catalysts could trigger regime shifts in correlation and volatility
- Portfolio gains are substantial after years of strong equity returns, making insurance more affordable and valuable
Rather than trying to time entries discretely, the recommendation is to implement systematic hedging strategies using instruments like VIX calls or VIX call spreads. The key insight: these positions should be sized to survive the carry bleed, allowing reinvestment at higher vol levels when risk events inevitably occur.
"Insurance is about losing money—you're rooting against your insurance. You don't want something to happen to your house, but you want to own flood insurance at the right price."
🎯 The Bottom Line
Markets are pricing in a continuation of extraordinarily low correlation and subdued volatility at a time when multiple structural uncertainties loom large. The setup recalls previous episodes where carry trades became crowded at precisely the wrong moment—but with far less obvious mechanical breaking points than vol-mageddon.
For portfolios sitting on substantial gains from the extended equity bull market, allocating to systematic tail hedging at these levels offers asymmetric payoff potential. The cost is the lowest it's been relative to history, even if it appears fair relative to recent realized volatility. And history suggests that when correlations and volatility do normalize higher, the moves tend to be swift and severe—precisely when having protection in place matters most.
The question isn't whether correlation will eventually mean-revert. The question is whether portfolios are positioned for when it does.
More from ForwardGuidanceBW

Gold, Bitcoin, and the End of Traditional Portfolio Construction
💡 The Evolution Beyond 60/40The traditional 60/40 portfolio—60% equities, 40% bonds—has served as the gold standard for...

Treasury Intervention, AI Valuation Hysteria, and Why the Debasement Trade Is Ba
📊 Market Structure: Low Volume, High InterventionMarkets entered the final stretch of summer in characteristic fashion ...

Treasury Ramps Up Buybacks: A Clear Signal of Policy Direction Ahead of Midterms
The US Treasury's announcement this week to at least double the size of liquidity support buyback operations for long-da...
Inside the Paradigm C Playbook: How Rising R-Star, Forward Guidance Removal, and
📊 The New Macro Regime: Welcome to Paradigm CMarkets have entered what 42 Macro founder Darius Dale terms "Paradigm C" ...
From Fed Dominance to Treasury Statecraft: How Bessent's Interventions Signal a
🌐 The Rubicon Has Been Crossed A fundamental shift in market architecture is underway, and most participants are only ...

Rethinking Risk: A 20% Allocation Strategy That Survived Every Crisis Since 1971
📊 A Portfolio Built for Stability in Chaotic TimesThe traditional investment playbook — dump everything into a 60/40 st...